October 16, 2026
In this project, I analysed river water quality in North England between 2023 and 2025 using R. I applied data cleaning, statistical testing, correlation analysis and visualisation to identify trends and relationships across water quality indicators, sampling locations and catchments, generating insights to support environmental monitoring and decision-making

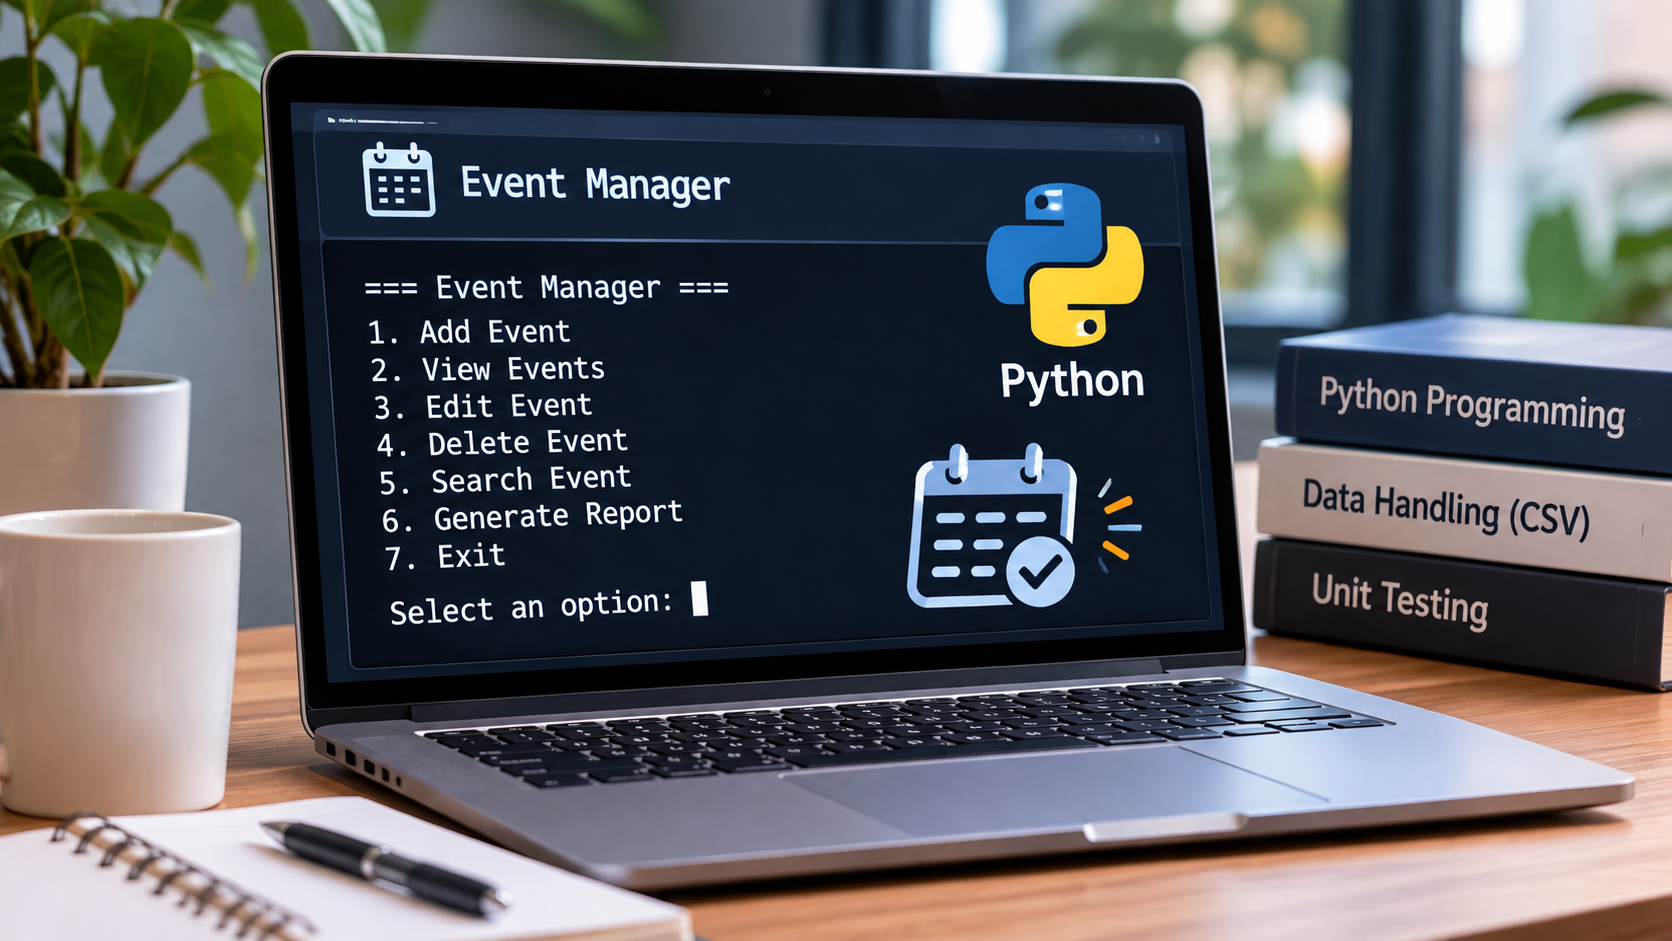
I developed a Python-based event management application that allows users to create, view, update and manage event records. The project uses object-oriented programming and CSV file handling to store and manage event data, with unit tests to validate application functionality
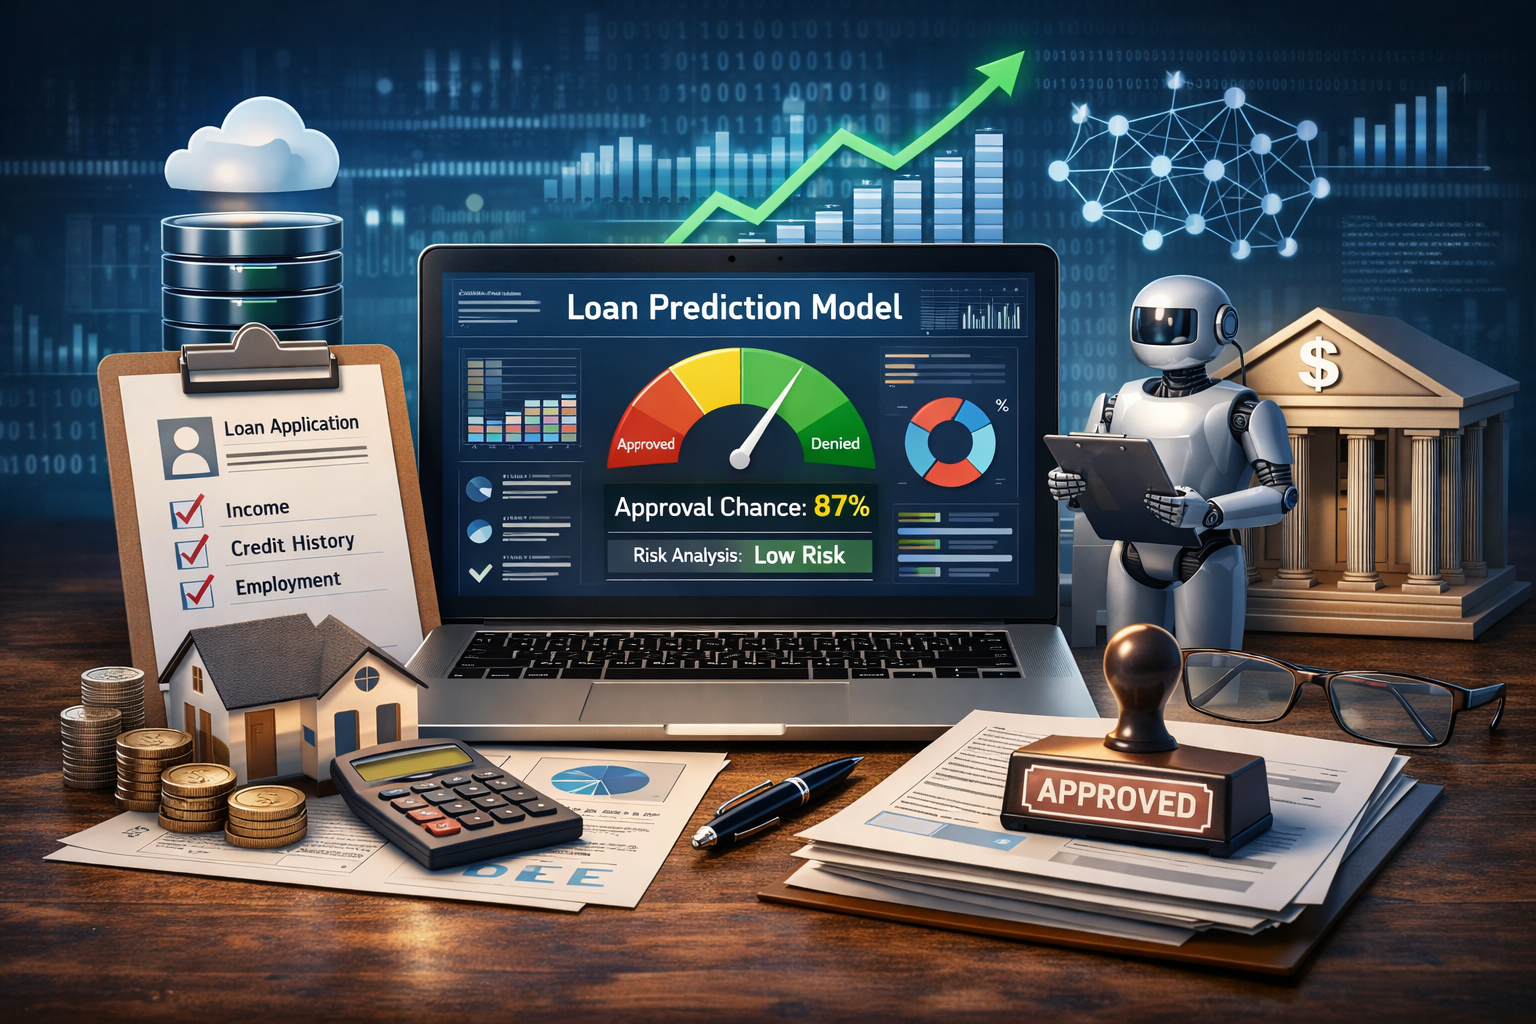
In this project, I built a Loan Prediction Application that helps financial institutions make faster and smarter lending decisions. The model analyzes applicant details such as income, loan amount, credit history, and employment status to predict loan approval outcomes. This solution reduces manual screening, improves decision accuracy, and supports data-driven loan processing.
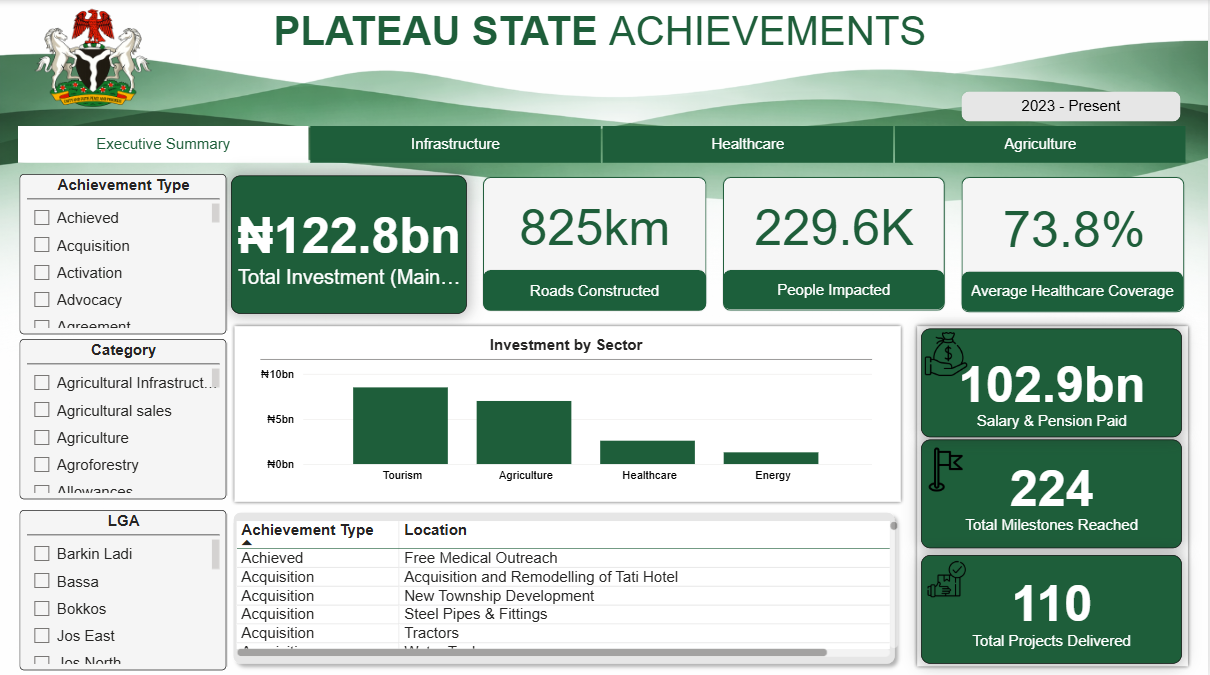
I designed an interactive Power BI dashboard analyzing key achievements of the Plateau State Government (May 2023 – Febraury 2026) across four major sectors; Infrastructure, Healthcare, Agriculture, Executive Summary (Cross-sector overview)
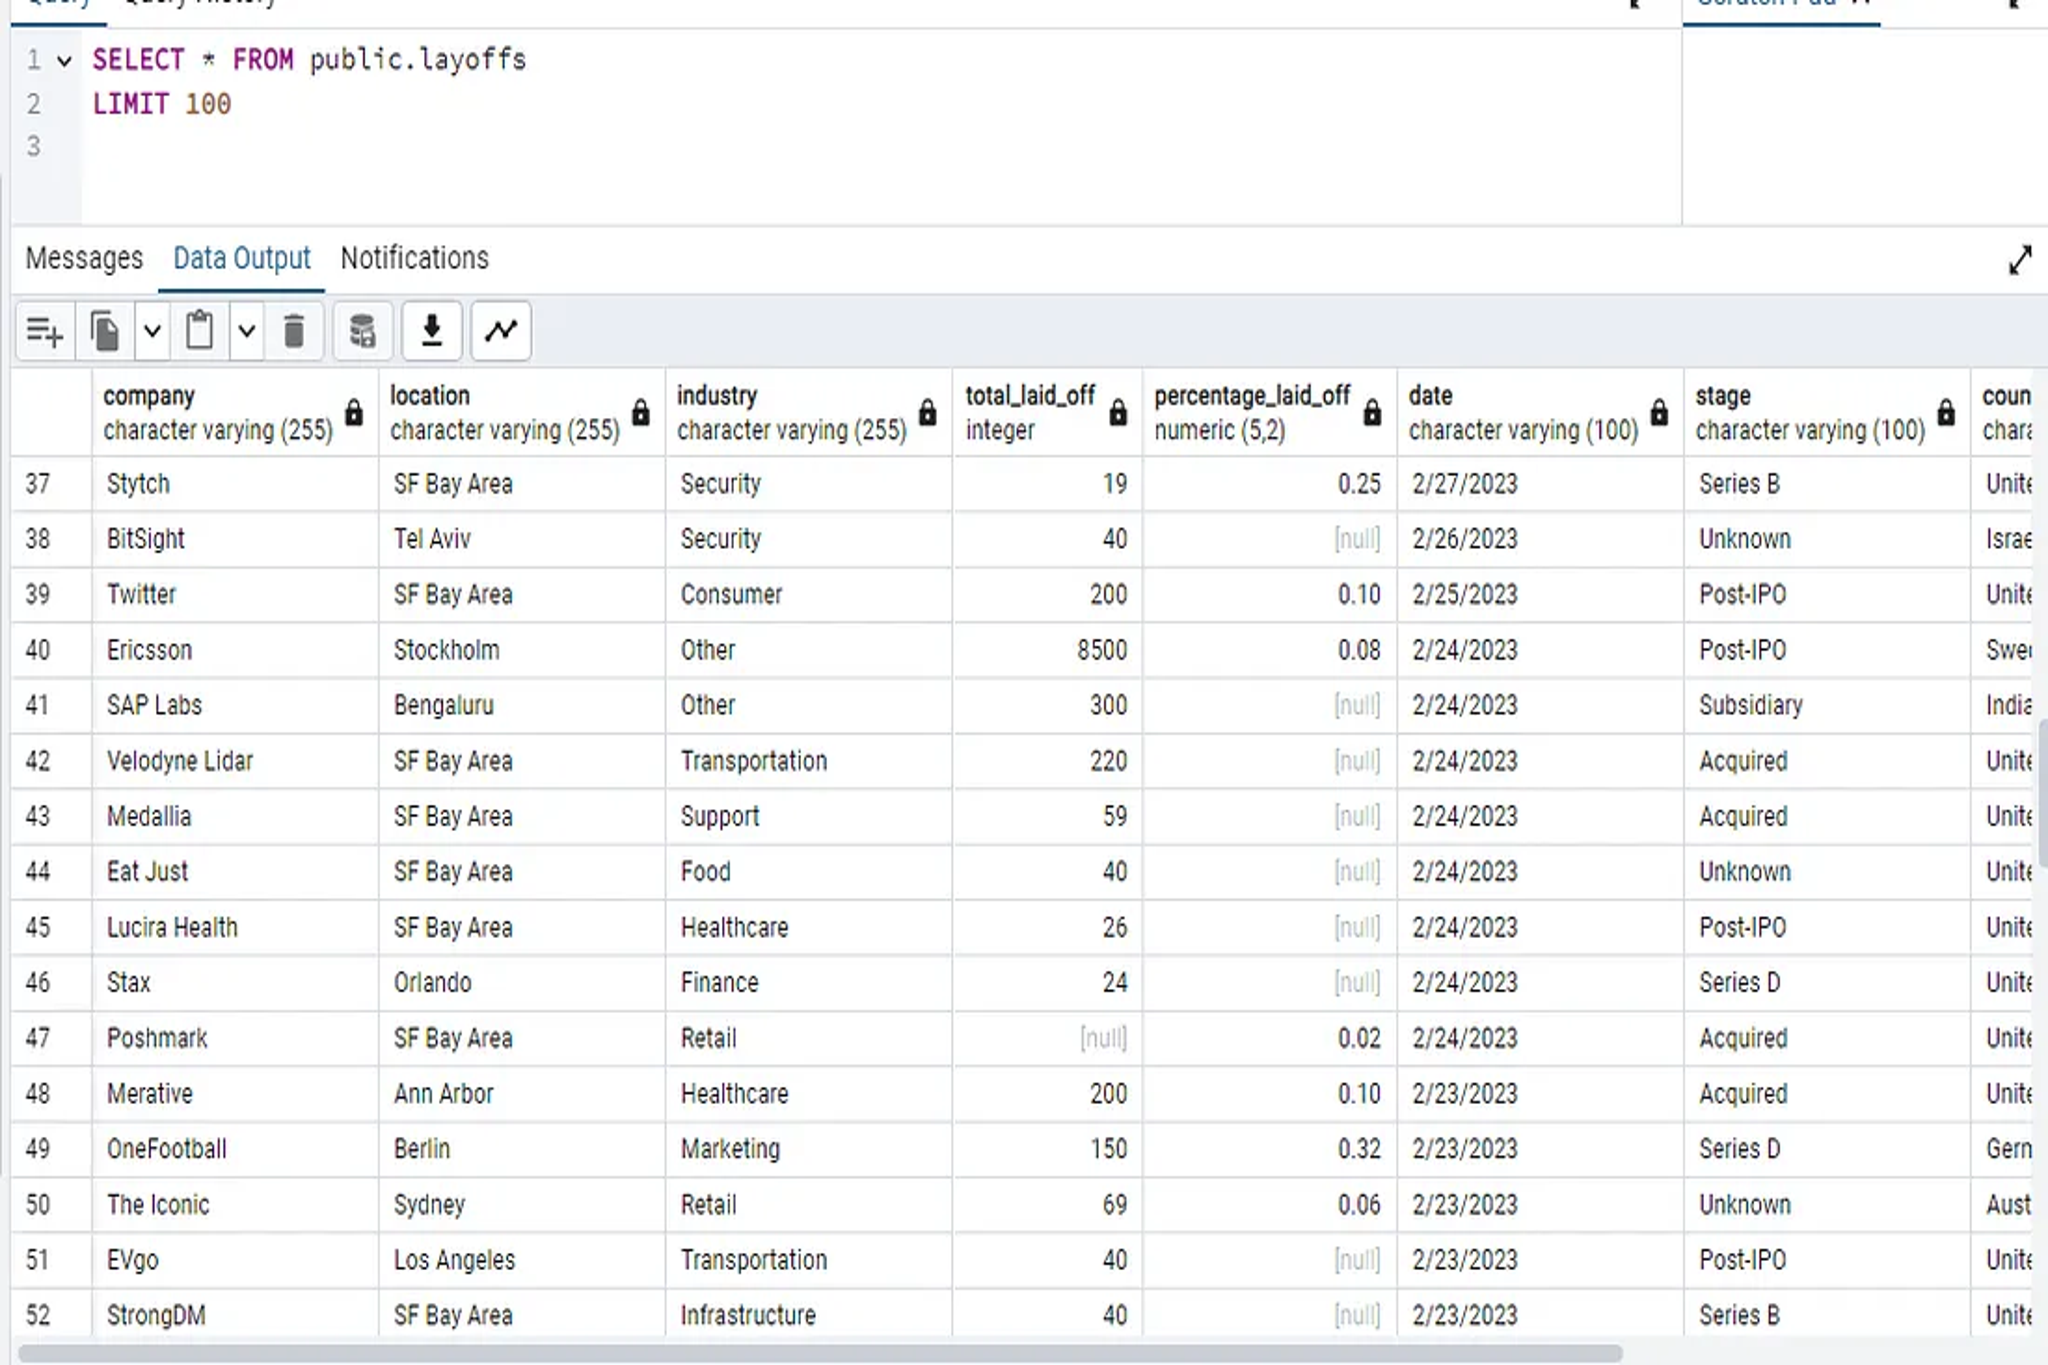
I cleaned and analyzed a global layoffs dataset using MySQL. Implemented staging tables, removed duplicates with window functions, standardized fields, handled nulls, and converted dates. Performed exploratory analysis using CTEs, aggregations, rolling totals, and ranking functions to uncover trends by company, industry, country, and year.
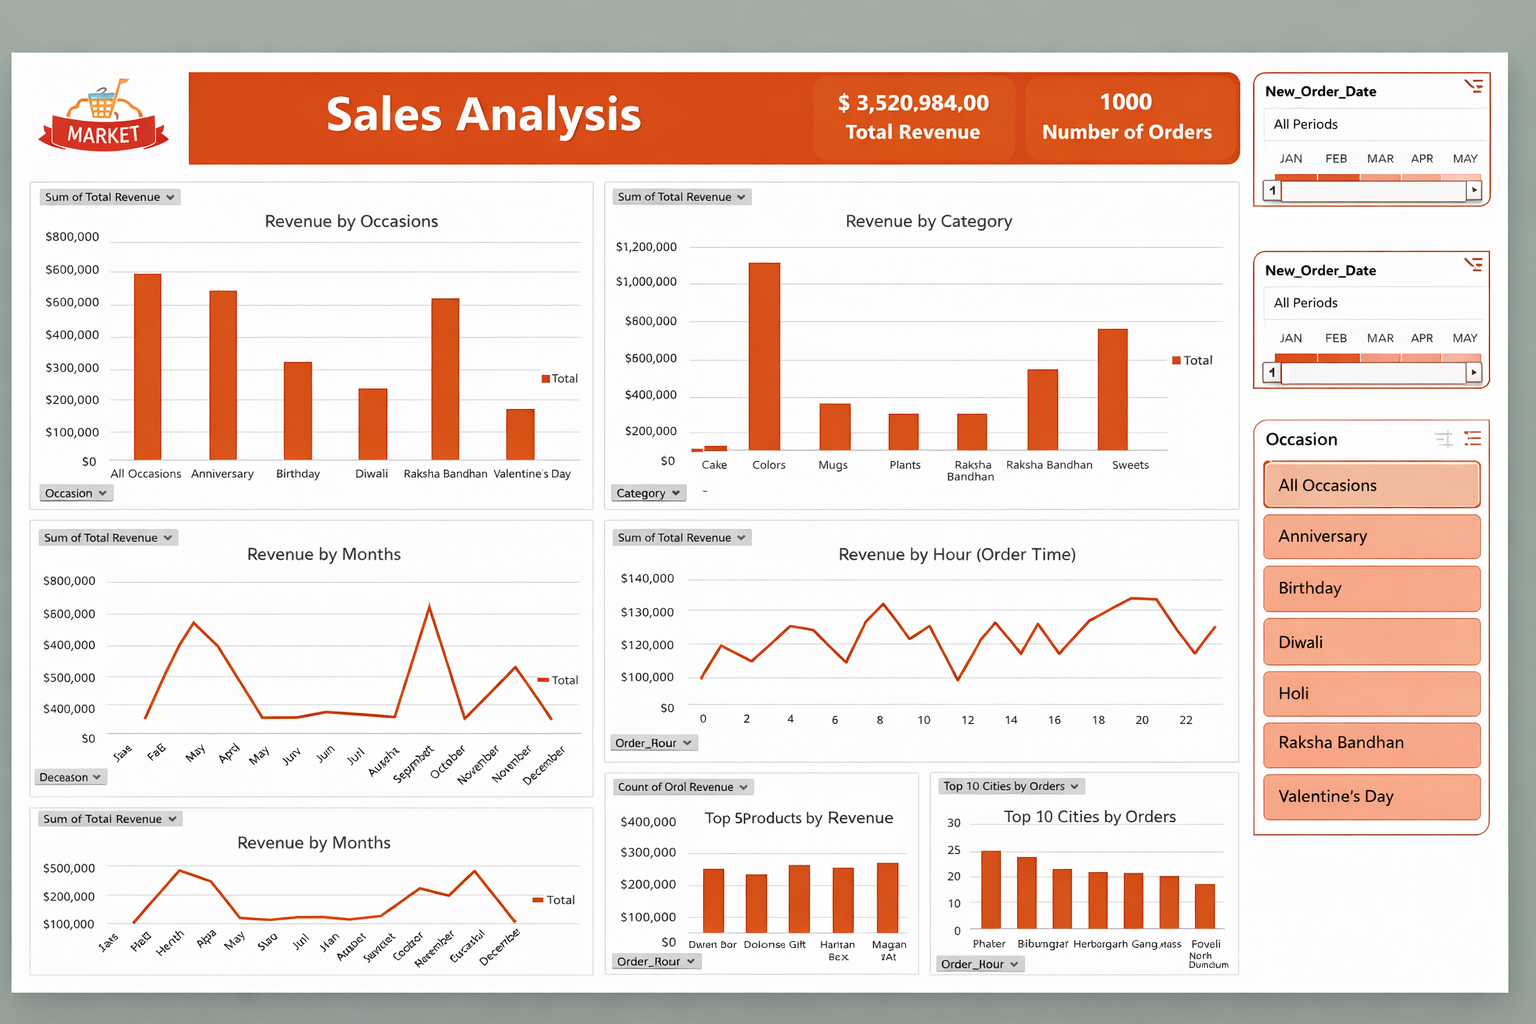
I analyzed sales and order data to evaluate revenue performance, customer spending patterns, product trends, and regional distribution. The interactive dashboard was built in Microsoft Excel, enabling users to track KPIs, identify peak sales periods, compare category performance, and support business plans anmd growth.
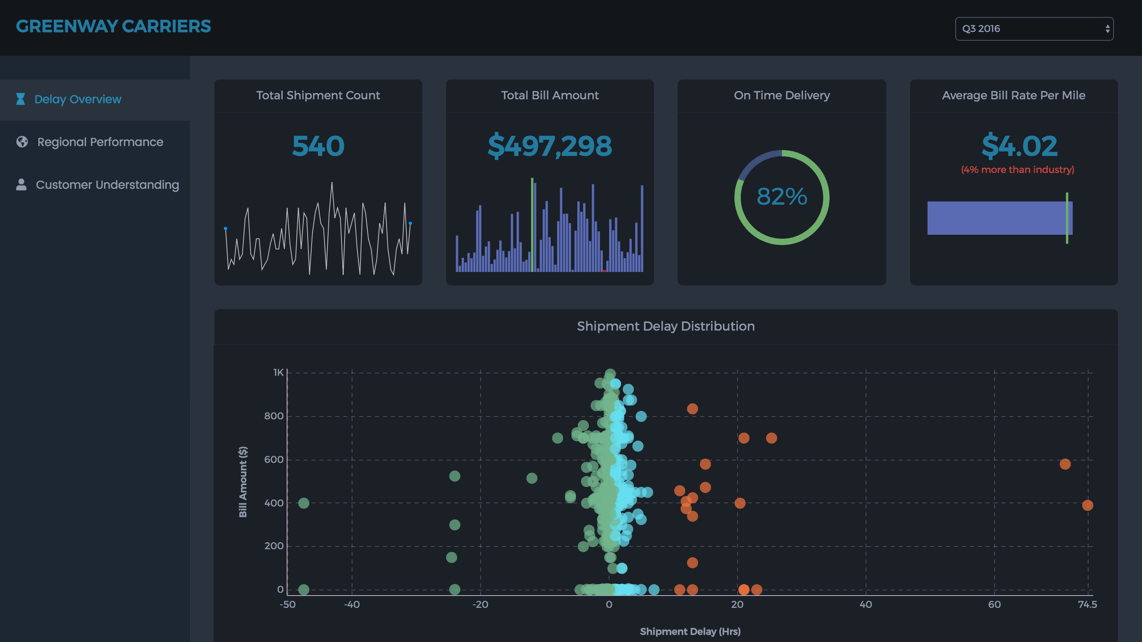
I analyzed shipment and logistics data to evaluate delivery performance, on-time vs delayed shipments, completion rates, and key operational trends across regions. The interactive dashboard was built in Microsoft Power BI, enabling users to track KPIs, identify bottlenecks, compare regional performance, and support data driven logistics decision making.
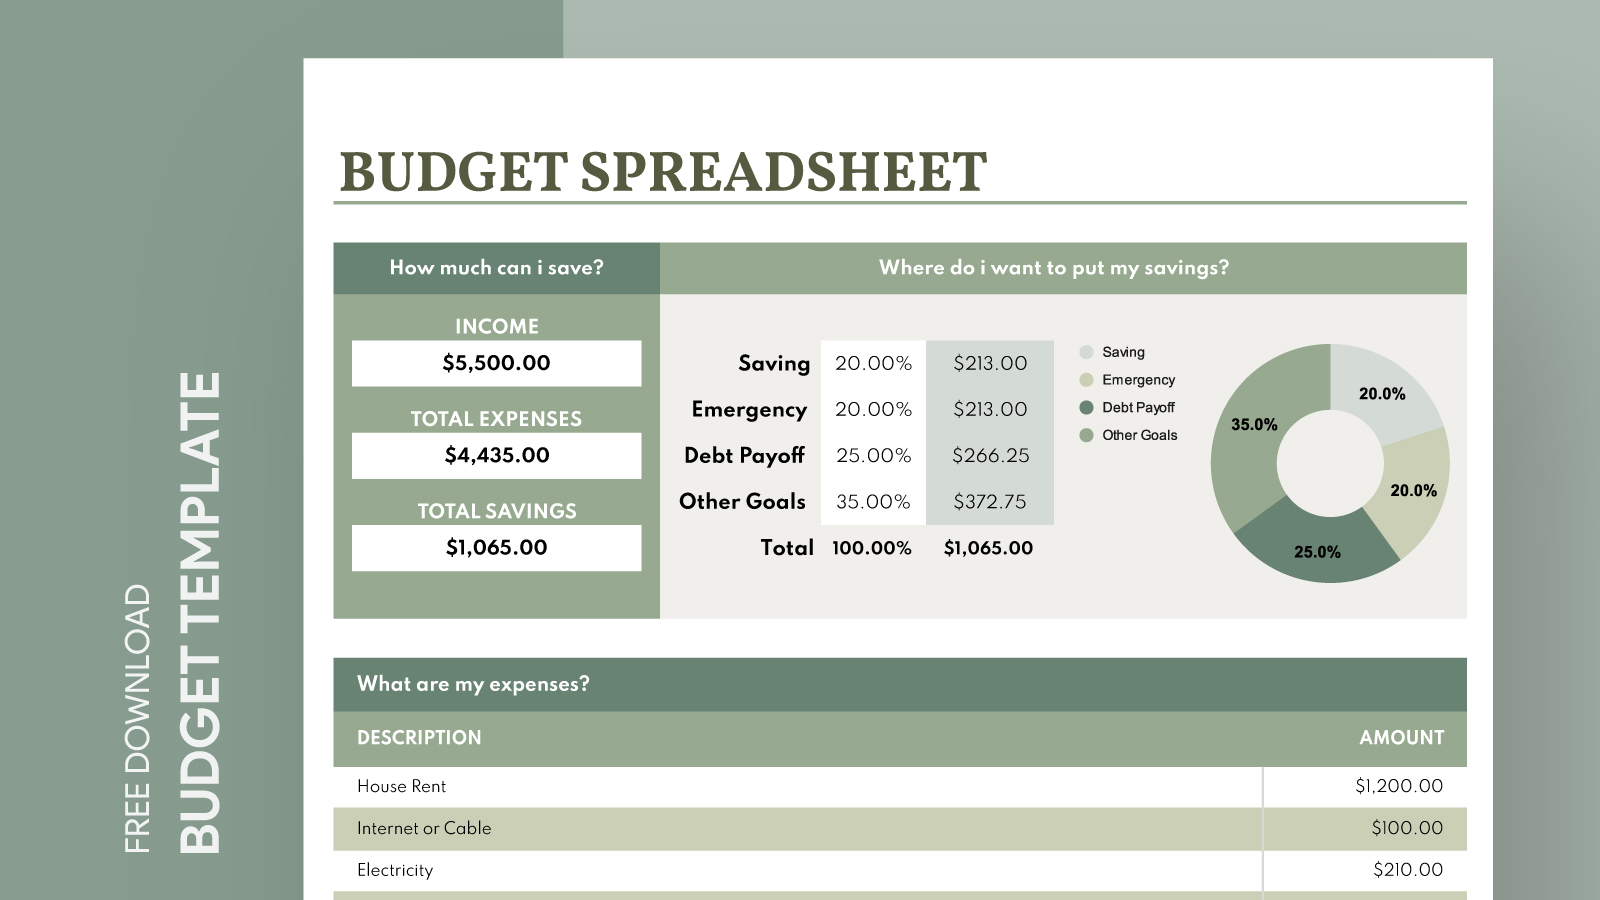
I developed a Monthly Spending and Budgeting Template designed to help users track expenses, monitor income, and understand spending habits across multiple accounts. It consolidates transactions into a summary dashboard that makes it easy to evaluate monthly performance, identify overspending categories, and improve financial planning.